

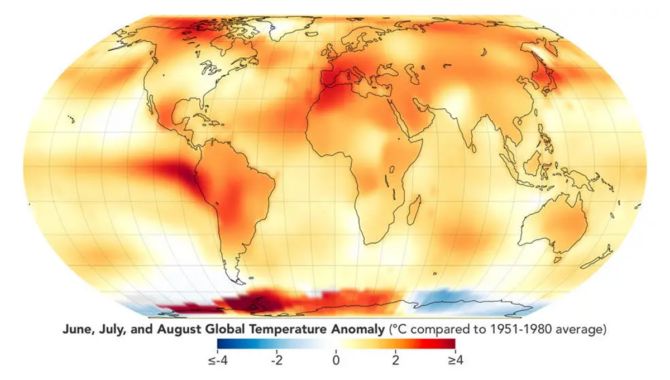
This map depicts global temperature anomalies for June, July, and August 2023. Areas in yellow and red were warmer than the baseline average from 1951 to 1980. Credit: NASA Earth Observatory/Lauren Dauphin
Year that began with a cooling trend quickly warmed to levels unprecedented since modern record-keeping began.
In early summer, 2023 began to surprise climate scientists. The year began with a cooling La Niña pattern and was expected to finish with average surface temperatures in line with long-term trends. But in March the 18-month La Niña ended, and surface temperatures were rising. By July, hundreds of millions of people in vast swaths of the northern hemisphere were sweltering under incredible heat. Remote villages in China recorded unusually high temperatures above 120° F.
Heatwaves in Europe pushed temperatures into triple digits in Italy, Spain, and Greece. The island of Sardinia logged a new record high temperature for all of Europe—118.4° F. Meanwhile, a large swath of the United States—including Arizona, Arkansas, California, Mississippi, Nevada, New Mexico, Oklahoma, and Texas—baked under excessive heat advisories. Phoenix, Arizona exceeded 110° F for more than 25 consecutive days—a record—with 11 of those days exceeding 115°. In late July, buoys off the south coast of Florida recorded unprecedented sea surface temperatures above 100° F.
From June through December, each month set a new global record for that month, with July being the hottest month ever recorded. When NASA looked at the data in early 2024, 2023 was the warmest year recorded by humans, with average surface temperatures a record 2.1 degrees Fahrenheit above the average from NASA’s reference period of 1951-1980, and about 2.5 degrees Fahrenheit warmer than the late 1800s, when modern record-keeping began.
This data visualization, which is updated monthly, shows the seasonal cycle of temperature variation on the Earth’s surface, and how those temperatures deviate from the average from 1951 to 1980. Credit: NASA’s Scientific Visualization Studio
“Remember that in February and March we were still in a very mild La Niña phase. And so that would have predicted that 2023 would have been slightly cooler than the long-term trend, and yet it was quite a lot warmer,” said Gavin Schmidt, director of NASA’s Goddard Institute for Space Studies (GISS), speaking at a NASA media briefing. “And so, we’re looking at this and we are frankly astonished. One of the things that we have historically liked to do in these briefings is give a little bit of a story about why any one year is different from any other year. And there are a lot of candidate stories this year, but none of them really work.”
Earth’s surface temperatures during a given year typically reflect a combination of long-term trends, such as those associated with climate change, and shorter-term influences, such as volcanic activity and the state of the El Niño-Southern Oscillation (ENSO), a complex climate phenomenon that shifts irregularly over a period of years between the warming and cooling of ocean surface temperatures, which then influences wind and rainfall patterns across the tropics and far beyond.
“It’s kind of easy to say, ‘Okay, well, we were coming into an El Niño towards the end of the year.’ But the El Niño that we’re seeing is not an exceptional El Niño. It’s not a bigger El Niño event than 2016. And in 2015 when we were ramping up to that big El Niño, we saw a change in temperatures that [was] less than half in the global mean than what we’ve seen in 2023,” Schmidt said. “And so, if we’re going to claim that 2023 was because of the ongoing El Niño towards the latter half of the year, you have to then explain why that’s never happened before.”
“Our normal story, our normal explanation for what’s going on does not work this year. And I think that there is a lot more work that needs to be done to really understand what happened in 2023,” Schmidt said.
Surface temperatures rose in oceans in 2023 as well, setting a record. Earth’s oceans absorb more than 90 percent of excess heat in the climate system. Scientists use a variety of instruments to measure ocean temperatures down to a depth of 2,000 meters.
“In 2023, the warmth of the world’s oceans hit a record, again. It’s the highest since records began six decades ago,” said Russ Vose, Chief of the Climate Analysis and Synthesis Branch at NOAA’s National Centers for Environmental Information, speaking at the briefing. “The five highest heat content values have all occurred in the last five years and there’s been a steady upward trend since about 1970. And as with surface temperature, each decade has been warmer than the decade that preceded it.”
“If it wasn’t for the oceans and their large heat storage capacity, the atmosphere actually would have warmed even more rapidly,” Vose explained. “And there are of course implications to this, like warmer ocean temperatures provide heat for tropical cyclones. They affect the frequency and intensity of marine heat waves. And because water expands as it gets warmer, it contributes to the ongoing increase in sea level.”
During the question-and-answer portion of the briefing, Schmidt and Vose were asked about concerns among some climate scientists that 2023 could mark a transformation in the pace of climate change.
“We have one extraordinary data point that is a little bit hard to explain. Until we have a better idea about exactly what was going on in 2023 it’s very hard to say whether … that was a blip or whether there’s something systematic that’s shifted. I think it’s too soon to tell,” Schmidt said.