


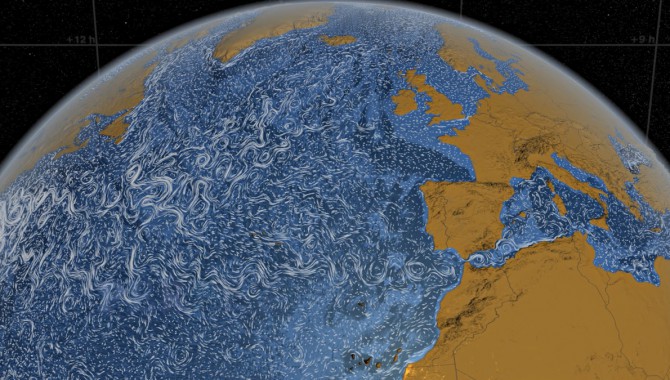
This visualization shows ocean surface currents around the world during the period from June 2005 through December 2007, produced using model output from the joint Massachusetts Institute of Technology (MIT)/Jet Propulsion Laboratory project: Estimating the Circulation and Climate of the Ocean, Phase II, or ECCO2. ECCO2 uses the MIT general circulation model to synthesize satellite and in-situ data of the global ocean and sea-ice at resolutions that begin to resolve ocean eddies and other narrow current systems, which transport heat and carbon in the oceans. ECCO2 provides ocean flows at all depths, but only surface flows are used in this visualization.
Photo Credit: NASA/Goddard Space Flight Center Scientific Visualization Studio