

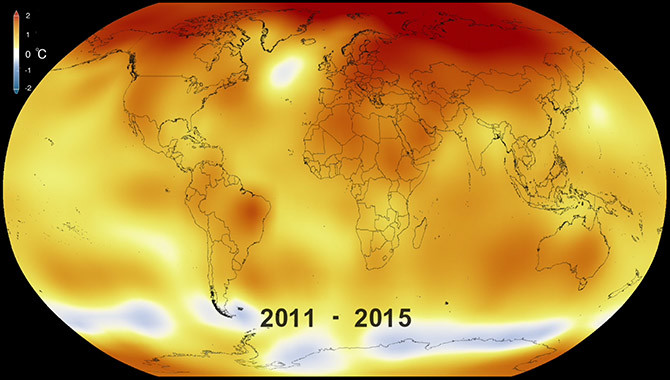
This image portrays the 5-year average global surface temperatures from 2010 through 2015. Higher temperatures than normal are shown in red while lower-than-normal temperatures are indicated in blue.
Image Credit: NASA/Goddard Space Flight Center Scientific Visualization Studio
Data from NASA’s Goddard Institute for Space Studies (GISS) and the National Oceanic and Atmospheric Institute (NOAA) confirm that 2015 was the warmest year on record.
“2015 clearly was the warmest year…by far warmer than any other year, breaking the temperature set previously in 2014, last year, by over a quarter of a degree Fahrenheit,” said Thomas Karl, director of NOAA’s National Centers for Environmental Information (NCEI) and chair of the Subcommittee on Global Change Research for the U.S. Global Change Research Program.
The record warmth was noted across the year, with ten of the twelve months breaking the previous all-time high. Furthermore, 2015 represented the first time that the temperature was a full degree Celsius higher than temperatures recorded before the Industrial Revolution.
According to Karl, the temperature in 2015 was not only “1.6 degrees [Fahrenheit] warmer than the 20th century average, but it’s over a degree Celsius warmer than…the average of the last 20 years of the 19th century. That’s fairly substantial.” He added that the greatest increases have occurred in the past 35 years. “[S]ince 1970, each decade is warmer than the previous decade.”
Data confirming the long-term trend was collected from weather stations around the world, ship measurements, and buoy measurements of ocean temperatures. Independently, NASA and NOAA worked with the raw data and then adjusted it as needed.
“[P]eople think that adjusting data is somehow a terrible thing,” said Gavin Schmidt, director of NASA’s GISS. “You have to take the raw data and deal with the inhomogeneities and the problems with that data. Because no dataset is perfect, whether it’s any weather station or the ocean buoys or even satellites.” For 2015, the raw data—without adjustments or corrections—clearly supported the conclusions reached by NASA and NOAA.
An El Niño event that began toward the end of 2015 contributed to the record warmth but was not responsible for the high temperatures for most of the year. “The reason why this is such a warm record year is because of the long-term underlying trend. And there is no evidence that that long-term trend has slowed, paused, or hiatused at any point in the last few decades,” Schmidt said.
Historic temperatures are expected to continue through 2016, which may break records just as 2014 and 2015 did. “If 2016 actually turns out to be as warm as we anticipate, then that would be three [years] in a row, and that would be unprecedented,” said Schmidt.
The increase in global temperature during 2015 was evident in all of the oceans and across landmasses as well. “[O]ur land temperatures broke the all-time warmest temperatures by a larger degree than any other record that we have had in the past,” Karl said.
Changes in ocean temperature were assessed in two ways. The first was by examining ocean surface temperatures, which have been persistently warm for decades. The second was to look at the amount of heat incorporated into the oceans.
“The rate at which heat goes into the ocean is really a measure of the radiative imbalance of the whole planet. So if there’s more energy coming into the system because of greenhouse gases or whatever, that heat—almost all of it—is ending up in the ocean. So the rise in ocean heat content is really a function of this ongoing radiative imbalance, driven in the most part by increases in carbon dioxide,” said Schmidt.
The trend toward higher temperatures is expected to persevere. “It will continue because we understand why it’s happening. It’s happening because the dominant forcing right now is the increase in carbon dioxide that’s produced from deforestation and the burning of fossil fuels.” Schmidt added, “This year was the last year that CO2 will go below 400 [parts per million] as far as the seasonal cycle.”
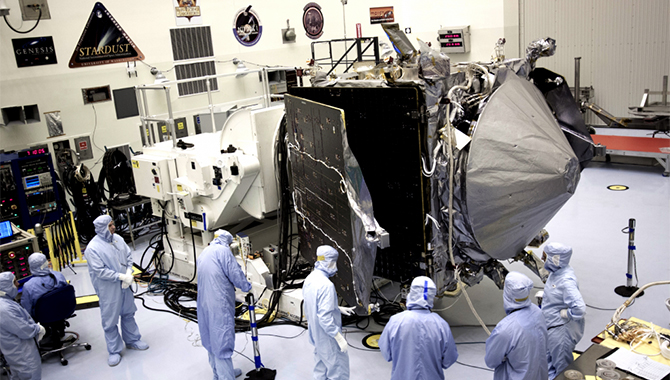
NASA and NOAA continue to advance missions that support a greater understanding of changes in global climate and the contributions of greenhouses gases to those shifts. The Orbiting Carbon Observatory 2 (OCO-2) is a key component in learning more about the behavior of atmospheric carbon dioxide.
“The eventual warming of the planet is actually quite closely controlled by the total amount of carbon dioxide we’re going to put in the atmosphere,” said Schmidt. “And the reason…is because carbon dioxide is long-lived in the atmosphere. The preservations from an emission now persist for hundreds of thousands of years.” OCO-2 will help scientists determine the sources and sinks—places where it is removed from the atmosphere—of the greenhouse gas.
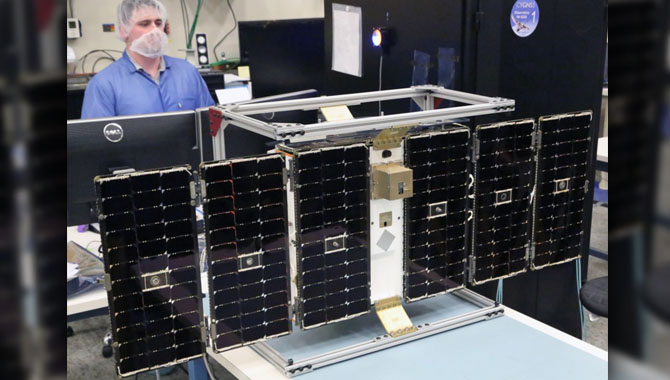
NOAA recently launched Jason-3, an international mission designed to track increases in global sea level and promote knowledge about the ocean’s role in climate. Jason-3, OCO-2, and other Earth-observation missions will enable scientists to gather and analyze detailed data so that world leaders and other experts can make informed decisions.
“We’re mainly physical scientists,” Schmidt stated. “We’re just seeing what’s going on and predicting what can go ahead. It’s really up to society and policy makers to decide what to do with that information.”
View a visualization of the increase in global warmth from 1880 to 2015.
Learn more about OCO-2.