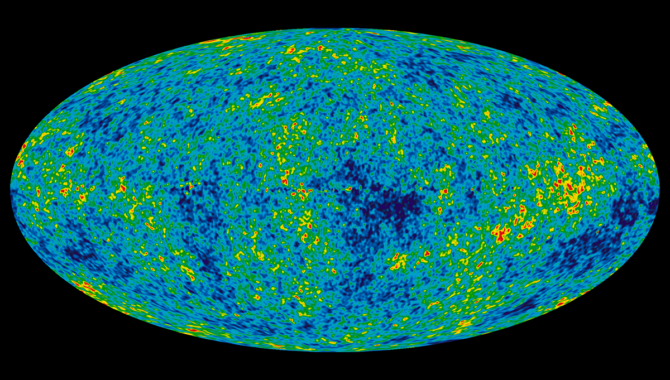
This detailed, all-sky picture of the infant universe was created from nine years of data gathered by the Wilkinson Microwave Anisotropy Probe. The image reveals 13.77 billion year old temperature fluctuations (shown as color differences) that correspond to the seeds that grew to become the galaxies. Credit: NASA
WMAP mission releases stunning map of the Cosmic Microwave Background, a “baby picture” of the Universe.
To the untrained eye, it was an unassuming dark blue oval with layers of green, yellow, and red. But the image released by NASA on February 11, 2003—21 years ago this month—represented nothing short of a turning point in cosmology. The swirling colors in the image were the most detailed representation yet of the Cosmic Microwave Background (CMB), the faint afterglow of the Big Bang that astronomers see between stars and galaxies when using powerful telescopes.
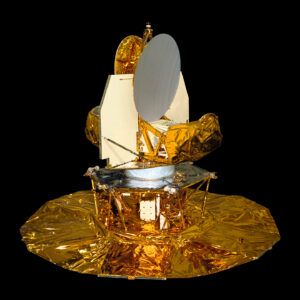
The image was the product of the first year of science by the Wilkinson Microwave Anisotropy Probe (WMAP), launched by NASA on June 30, 2001. The WMAP carried sophisticated instruments that were approximately 45 times more sensitive than NASA’s previous mission to examine the CMB a decade earlier. It was immediately apparent that WMAP represented a bold step forward in the field.
“We’ve captured the infant Universe in sharp focus, and from this portrait we can now describe the Universe with unprecedented accuracy,” said Dr. Charles L. Bennett of the Goddard Space Flight Center, Greenbelt Md., in a NASA press release. Bennett was the Principal Investigator for WMAP. “The data are solid, a real gold mine.”
WMAP was about 12 feet tall and 16.5 feet wide once the combined solar array and sun shield was deployed in space. The spacecraft carried a differential pseudo-correlation radiometer with polarization that could measure the temperature difference between two points in the sky to an accuracy of one millionth of a degree. The instrument operated in five frequency bands from 22 to 90 GHz to better separate foreground signals from the CMB.
The spacecraft orbited the Sun at a spot 1 million miles from Earth, the second LaGrange point (L2) in Earth’s orbit around the Sun. L2 has a cold, stable thermal environment, which was important for WMAP to accurately measure the CMB, which has an average temperature of minus 455 degrees Fahrenheit. It is also a point where the gravitational forces of the Sun and Earth and the orbital motion of a spacecraft are balanced, so that WMAP orbited the Sun approximately in line with Earth and required minimal station keeping. The James Webb Space Telescope is currently orbiting at L2.
Data from WMAP’s first year in operation was a revelation, revealing that the first stars in the Universe formed much earlier than scientists had thought, just 200 million years after the Big Bang. These first stars, scientists now believe, were hundreds of times larger than our Sun, burning much brighter before rapidly becoming supernovae.
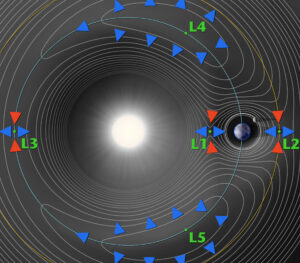
Diagram of the gravitational potential (white lines) associated with the Sun-Earth system. Lagrange Points, designated by L1 to L3 (dynamically unstable) and L4 and L5 (stabilize by Coriolis effect), are positions in space where the gravitational forces produce enhanced regions of attraction (red arrows) and repulsion (blue arrows). Note: Image is not to scale.
Credit: NASA / WMAP Science Team
One key question the WMAP was designed to examine was how stars, galaxies and large-scale structures formed in the early Universe. Cosmologists at the time believed that the galaxies grew from the gravitational pull of small fluctuations in the nearly-uniform density of the early Universe, according to the WMAP website. “These fluctuations leave an imprint in the cosmic microwave background radiation in the form of temperature fluctuations from point to point across the sky. The WMAP satellite measures these small fluctuations in the temperature of the cosmic microwave background radiation and in turn probes the early stages of structure formation,” the site reads.
WMAP’s first year of data suggested the Universe was 13.77 billion years old and supported the theories of the Big Bang and Cosmic Inflation. The data indicated that the Universe was composed of just 4 percent ordinary matter (atoms). Most of the Universe, WMAP’s data indicated, was dark energy—73 percent, with dark matter accounting for 23 percent. (Current estimates place dark matter at 27 percent of the Universe, with dark energy at 68 percent, and ordinary matter at 5 percent.)
“This is a beginning of a new stage in our study of the early Universe,” said David N. Spergel, a professor at Princeton University, and a member of the WMAP team, quoted in a NASA press release. “We can use this portrait not only to predict the properties of the nearby universe, but [also] to understand the first moments of the Big Bang.”
WMAP operated for nine years, collecting data for the last time on August 20, 2010. On 29 December 2012, NASA released the final WMAP data and images. By that time, the team had refined the age of the Universe to 13.77 billion years old, with a degree of error of one percent. The data pointed to curious patterns in the CMB that later missions would examine.
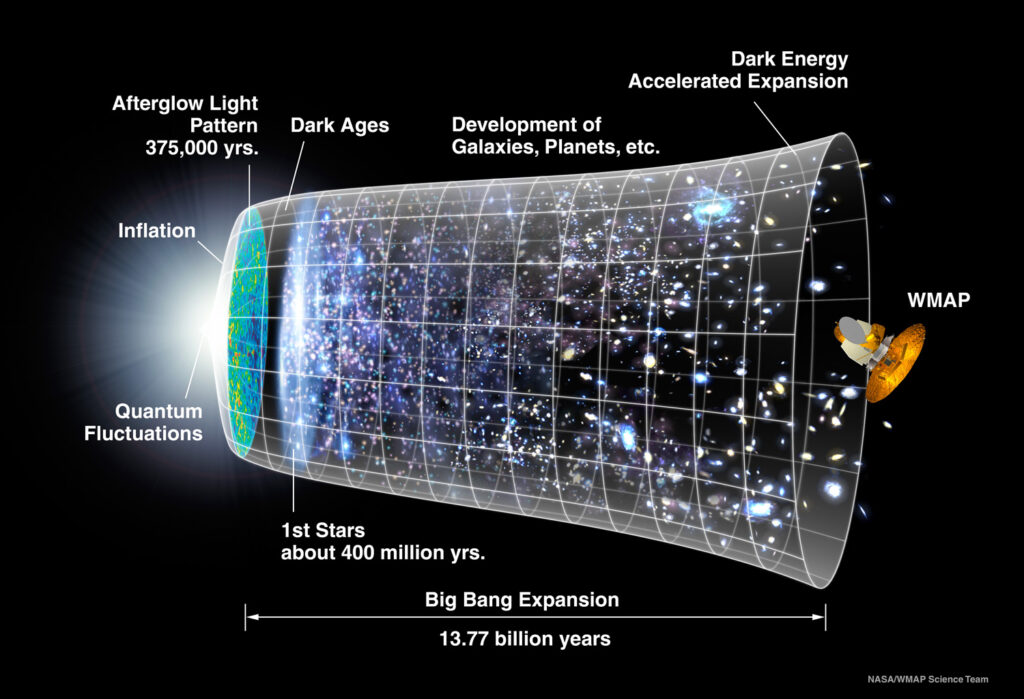
A representation of the evolution of the universe over 13.77 billion years. The far left depicts the earliest moment we can now probe, when a period of “inflation” produced a burst of exponential growth in the universe. (Size is depicted by the vertical extent of the grid in this graphic.) For the next several billion years, the expansion of the universe gradually slowed down as the matter in the universe pulled on itself via gravity. More recently, the expansion has begun to speed up again as the repulsive effects of dark energy have come to dominate the expansion of the universe. The afterglow light seen by WMAP was emitted about 375,000 years after inflation and has traversed the universe largely unimpeded since then. The conditions of earlier times are imprinted on this light; it also forms a backlight for later developments of the universe.
Credit: NASA / WMAP Science Team
The final data also supported the theory that the Universe expanded exponentially in the first trillionths of a second, ruling out some theories of how that happened, while supporting others.
“It never ceases to amaze me that we can make a measurement that can distinguish between what may or may not have happened in the first trillionth of a second of the universe,” said Bennett in a 2010 NASA press release about the end of the mission.
WMAP data provided precise measurements of the fundamental parameters of the universe, which scientists continue to use. In 2018, the WMAP team was awarded The Breakthrough Prize in Fundamental Physics for their work on the mission. WMAP research papers were among the most widely cited scientific papers in the world across all scientific disciplines for a decade.
“Every astronomer will remember the moment he heard the results from WMAP,” said John Bahcall (1934–2005), then a Professor of Astrophysics in the School of Natural Sciences at the Institute for Advanced Study. “Before the WMAP results, astronomers and physicists had put together a very implausible picture of our universe. It had a tiny amount of ordinary matter. It had a modest amount of dark matter, whatever that is. It had an overwhelming amount of dark energy, which is a strange beast. I have to confess I was very skeptical of this picture. But the WMAP results have convinced me,” Bahcall added.
To learn more about the Wilkinson Microwave Anisotropy Probe, visit the mission page here.


